Agriculture
2025
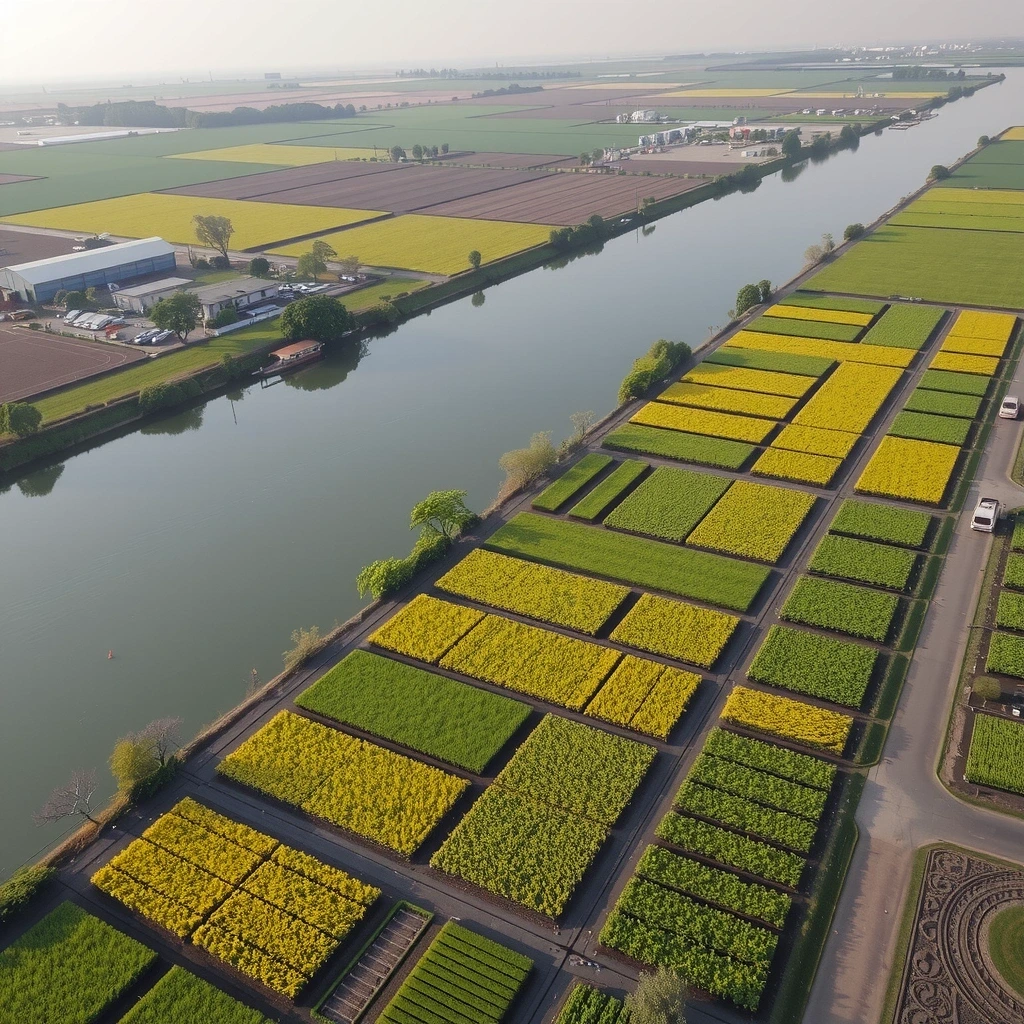
Runoff Modeling
Predicting fertilizer leaching into the Yamuna tributary during monsoon peaks.
Explore the definitive projects where GangaAnalytics.digital has deployed advanced data methodologies to solve critical challenges across the Ganga basin. From sediment tracking to restoration monitoring, see how raw data transforms into actionable environmental policy.
Active Catchments
14
Data Points
2.4M+
Satellite imagery offers the macro view, but the truth of the river lies in the mud. Our Varanasi-based field teams operate as the critical validation layer for every algorithm we deploy. They deploy river gauges, collect water samples, and map the subtle shifts in the river's course that digital models might miss. This rigorous "boots-on-the-ground" approach ensures that our data isn't just mathematically sound—it's river-real.
We specialize in the difficult middle stretches of the basin, where industrial discharge meets agricultural runoff. By correlating historical discharge data with current flow rates, we identify persistent pollution sources and seasonal anomalies. This project workflow moves seamlessly from field collection to cloud processing, creating a longitudinal dataset that spans the entire monsoon cycle.
Explore our methodology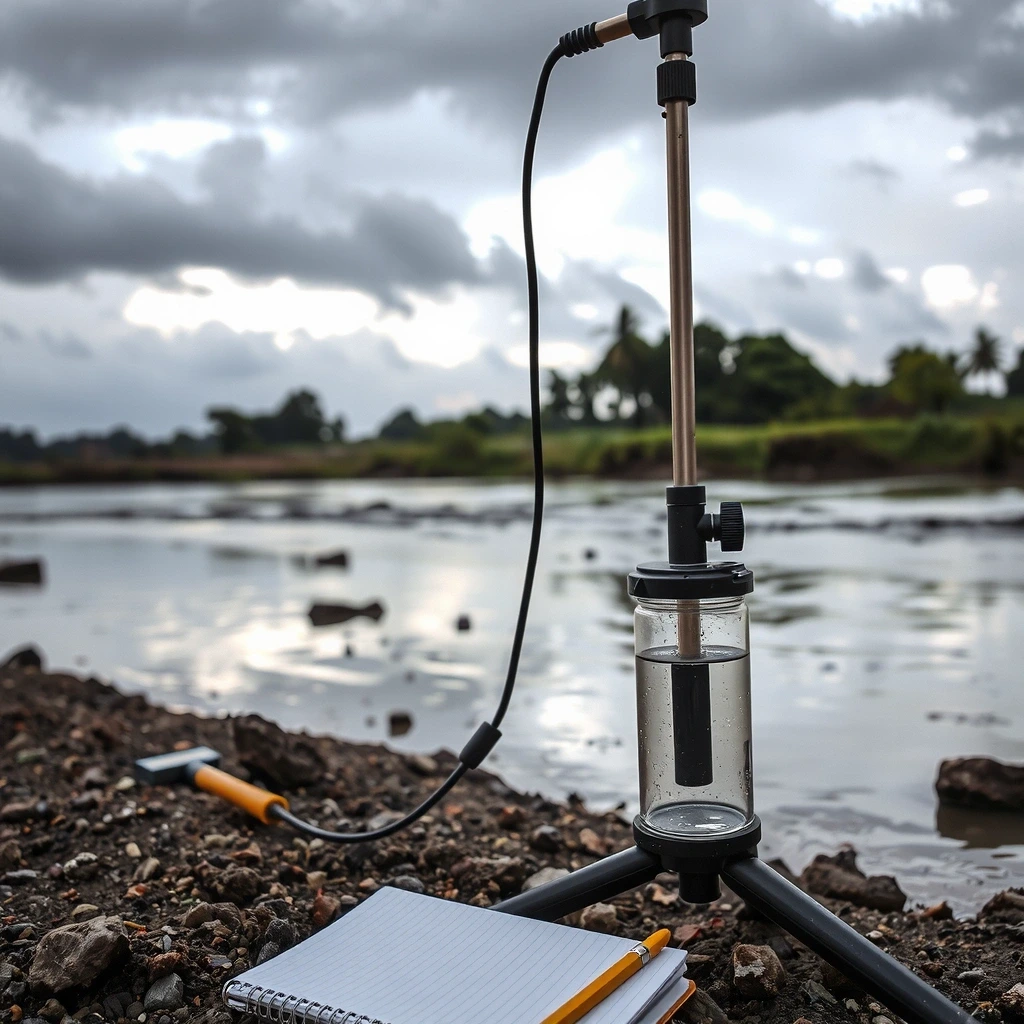
Field Validation Site: Varanasi West Bank
A high-stakes intervention to map and mitigate illegal effluent discharge into the primary urban water supply.
Using Landsat 8 thermal bands, we identified 14 distinct thermal plumes along a 12km stretch indicating illegal hot water discharge from industrial units.
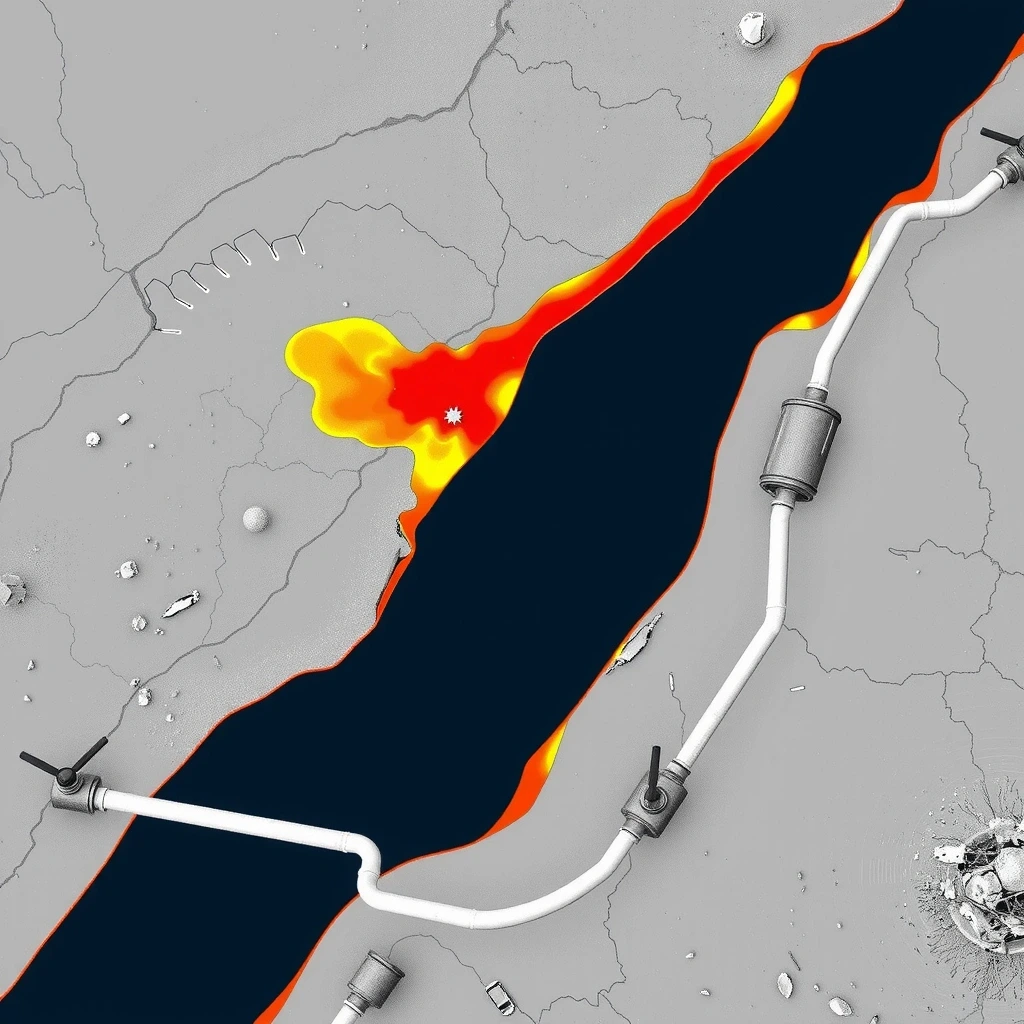 NDVI & LST Analysis
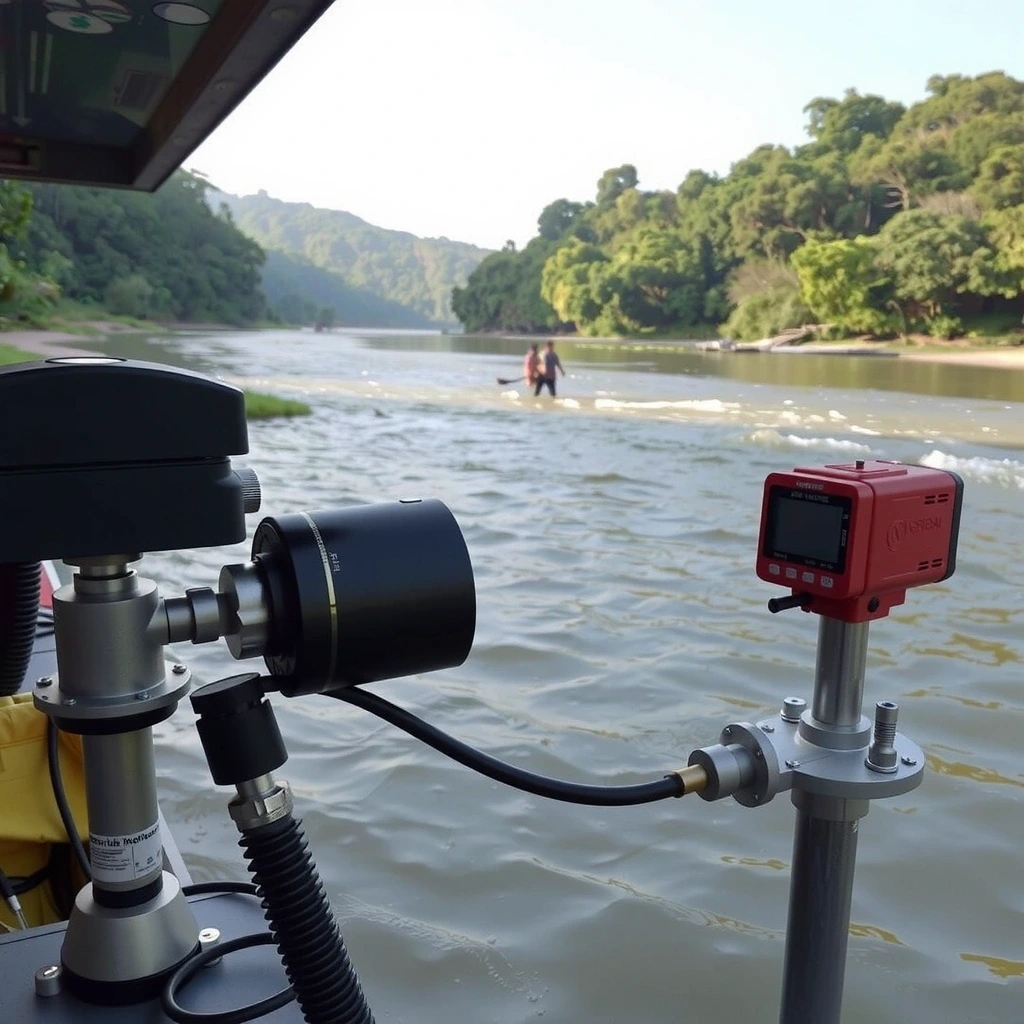
Field teams deployed multi-parameter sondes to verify satellite data. We discovered a correlation between thermal spikes and a 40% drop in dissolved oxygen levels.
Critical threshold breached
Data presented to the Uttar Pradesh Pollution Control Board resulted in the immediate closure of 3 non-compliant units and the installation of mandatory monitoring stations.
"The granular data provided by GangaAnalytics.digital gave us the undeniable evidence required to enforce regulations."
U.P. Pollution Control Board
Highlights from our ongoing basin monitoring initiatives.
Predicting fertilizer leaching into the Yamuna tributary during monsoon peaks.

Mapping flood resilience for low-lying neighborhoods in Kanpur.
Assessing macroinvertebrate populations as indicators of ecosystem recovery.
Understanding the specific metrics we track is key to interpreting the health of the basin. Here is how we define success.
Deep Dive into MethodsThe concentration of solid particles suspended in water. High TSS reduces light penetration and harms aquatic vegetation. We measure this via Landsat SWIR bands.
The amount of dissolved oxygen needed by aerobic biological organisms to break down organic material. A primary indicator of organic pollution.
Used to monitor water bodies in satellite imagery. It utilizes the Green and Near-Infrared (NIR) bands to highlight water surface area.
The cumulative impact of human activity on the river system, including sewage, industrial effluent, and agricultural runoff.
Whether you are an environmental agency, a research institution, or a corporate partner, we can tailor a data solution for your specific requirements.
88 Ganga Marg, Varanasi • Mon-Fri 9:00-18:00